Sleep
Note about browsers: This site works best using Google Chrome or Firefox. If any of the graphics look funny, please check what browser you’re using. Internet Explorer won't display properly unless you're using IE version 9.0 or later. Enjoy the data!
----------------
The sleep data here represent thousands of people who have participated in our research events at school and community health fairs as volunteer research subjects. At the sleep station, individuals answered a computer questionnaire about their sleep quality, daily patterns of wakefulness (chronotype), and daytime sleepiness. Click here for more about the different sleep surveys, how we determined the results, and additional resources.Tools
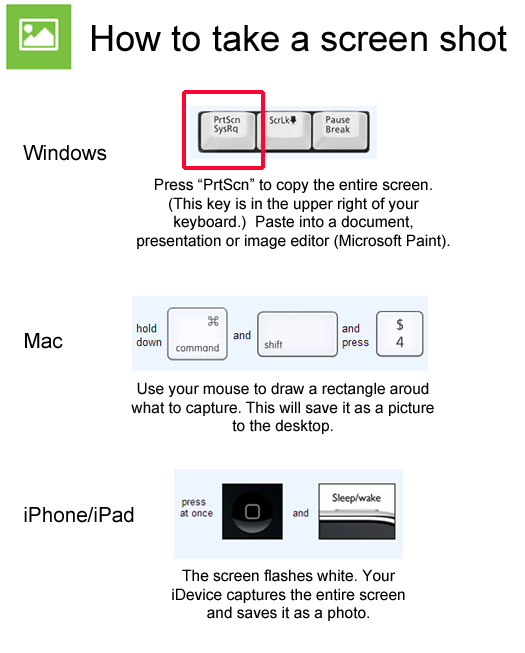 For more details on how to paste your screenshot into a document, presentation or image editor, please visit our help page.