SeeIt Help
 Overview of See It
SeeIt is a data visualization and manipulation tool that was developed by Dr. Marco Molinaro’s project team at the University of California – Davis. It allows the user to quickly explore data distributions and correlations between variables using drag and drop procedures. Our collaboration with their team integrates this amazing tool with our data so that the public can quickly visualize all of the data coming from our fairs. The statistical and graphical representations are modified in real time. Plus, with every new Let’s Get Healthy! fair, more data are added to SeeIt! Use SeeIt to explore:
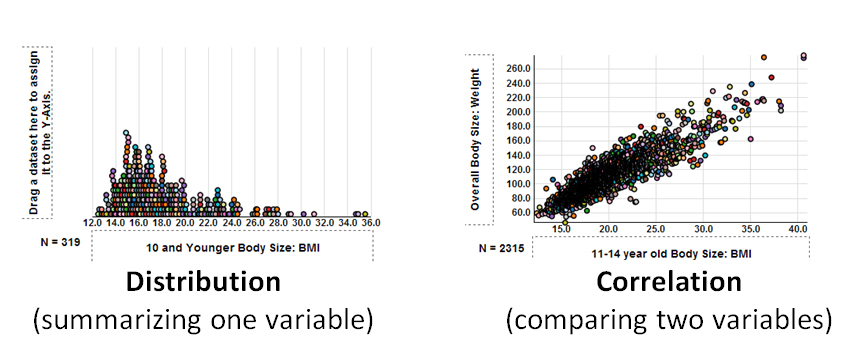
Distributions – which represent the data in dot-plots and/or histograms. There is an extensive feature set that allows you to explore mean, median, mode, user defined groups, and box plots. A sampling engine was also added which allows you to see the effects of sample size on the measures of central tendency.
Correlations – which allow any two datasets to be graphed as an XY pair if they share a common descriptor (for instance, dairy intake versus BMI can be graphed for participants who completed both measures). Use the tools to estimate and/or measure the strength of correlation. A user-defined line and user-defined “balloon” can be used to subjectively visualize the data trend and general fit. For a more objective approach, a median-median line can be drawn. Lastly, a least-squares regression can be graphed along with r-value. As with Distributions, an edit mode allows the user to readily observe the effect of outliers on r-value and regression line in realtime as the data is edited. Lastly, two different regressions can be compared side by side.
Basic Instructions
1. From the main page, click on the blue “Explore Data” box
2. Click on the type of data you want to see (Body Size, Diet, Sleep, Cancer Risk, etc).
3. From the green “Tools” menu, click on the graph icon to go to SeeIt
4. Tab between Distributions and Correlations to see the data!
Tutorials
Use this instructional overview (.docx or .pdf – 25 pages) to find information on how to: